
Platform · SP3-RiskModel · Our Flagship Product
Know how your building will perform before the earthquake happens.
Building-specific, site-specific seismic risk assessment for any level of building information — the only commercial solution that predicts component-level losses and the recovery times that drive business interruption.
Reliable loss results in minutes, a comprehensive client-ready report at the click of a button, and four license levels that grow with your project's needs.
How it works
-
Describe the building
Address, age, size, and structural system — SP3 fills in site class and seismic hazard automatically from the USGS models.
-
SP3 builds the risk model
Structural properties, building components, and responses populate from research-backed databases. Override any input when you want finer control.
-
Run the analysis
The engine computes full Monte Carlo FEMA P-58 results in minutes — losses, damage, downtime, and recovery.
-
Deliver the report
Comprehensive, professionally formatted reports generate automatically, with the calculations laid out transparently.
Decision outputs
Seismic risk decisions need more than one loss estimate. Every SP3-RiskModel analysis produces distinct, connected outputs — each a plain-English answer to a question your client is going to ask. The figures below come from the sample reports at the bottom of this page: an 8-story steel BRBF office building at 123 Main St, San Francisco.
Repair Cost
Quantify repair cost due to earthquake damage across every level of shaking or earthquake scenario.
Exposure
How much of the building's value is at risk in an earthquake — and which parts of the building carry that risk, broken down by component group.
Loss Drivers
Identify which components are behind the repair bill and design targeted retrofit strategies.
Structural Response
Estimate peak story drifts and peak floor accelerations at every story and ground shaking intensity — see where the system is working the hardest and where demands concentrate.
Life Safety
The chance that someone in the building is hurt, due to both structural and nonstructural vulnerabilities.
Red Tag & Collapse
How likely the building is tagged as unsafe, needs to be demolished post-event, or collapses due to severe damage.
Recovery Time
How long until the building can be re-occupied, used for business, or fully repaired after the event, based on the ATC-138 Functional Recovery Methodology.
What Blocks Recovery
Recovery isn't one number. Every simulation tracks which system keeps the building shut — jammed doors and stairs at first, then the long tail: elevators, power, water and HVAC equipment with long lead times.
USRC Rating
FEMA P-58 results mapped onto the U.S. Resiliency Council's three dimensions — Safety, Damage and Recovery.
Values plotted from the sample SP3-RiskModel reports below — FEMA P-58 loss methodology with ATC-138 (Beta) functional recovery, SP3 Platform v15.0.0 (USRC rating summary from the v14.7.1 sample). A sample model at a real address, not a client project.
Key capabilities
Building-Specific Modeling
FEMA P-58 made simple: SP3 automates the methodology around your specific building, and every automated attribute can be overridden.
Seismic Hazard Lookup
Site class and hazard fill in automatically from the USGS Vs30 model and the National Seismic Hazard Map — no separate hazard study needed.
Design Database
Automated design models derive your building's structural properties from its age, governing design code, site, and configuration.
Response Prediction Engine
Structural responses are estimated automatically from building-specific structural properties — no structural model required.
Component Population Engine
Building components populate automatically from age, occupancy, layout, and structural system — a realistic inventory without the manual takeoff.
Stability Calculations
Building stability checks run automatically using the FEMA P-154 methodology.
Recovery Time Modeling
Downtime and recovery predictions use the ATC-138 Functional Recovery Method — the modern standard for recovery-based design.
Fast, Scalable Analysis
Full Monte Carlo risk results in minutes, scaling from one building to entire inventories.
Automated Reports
Comprehensive, client-ready risk reports generate automatically — see the samples below.
Automated risk analysis reports
Hand your client a report, not a spreadsheet. Every license level generates professionally formatted documentation — repair costs, reoccupancy and functional recovery times, charts, and the calculations behind them — so results are easy to defend and easy to understand.
Click any report to open the full PDF sample.
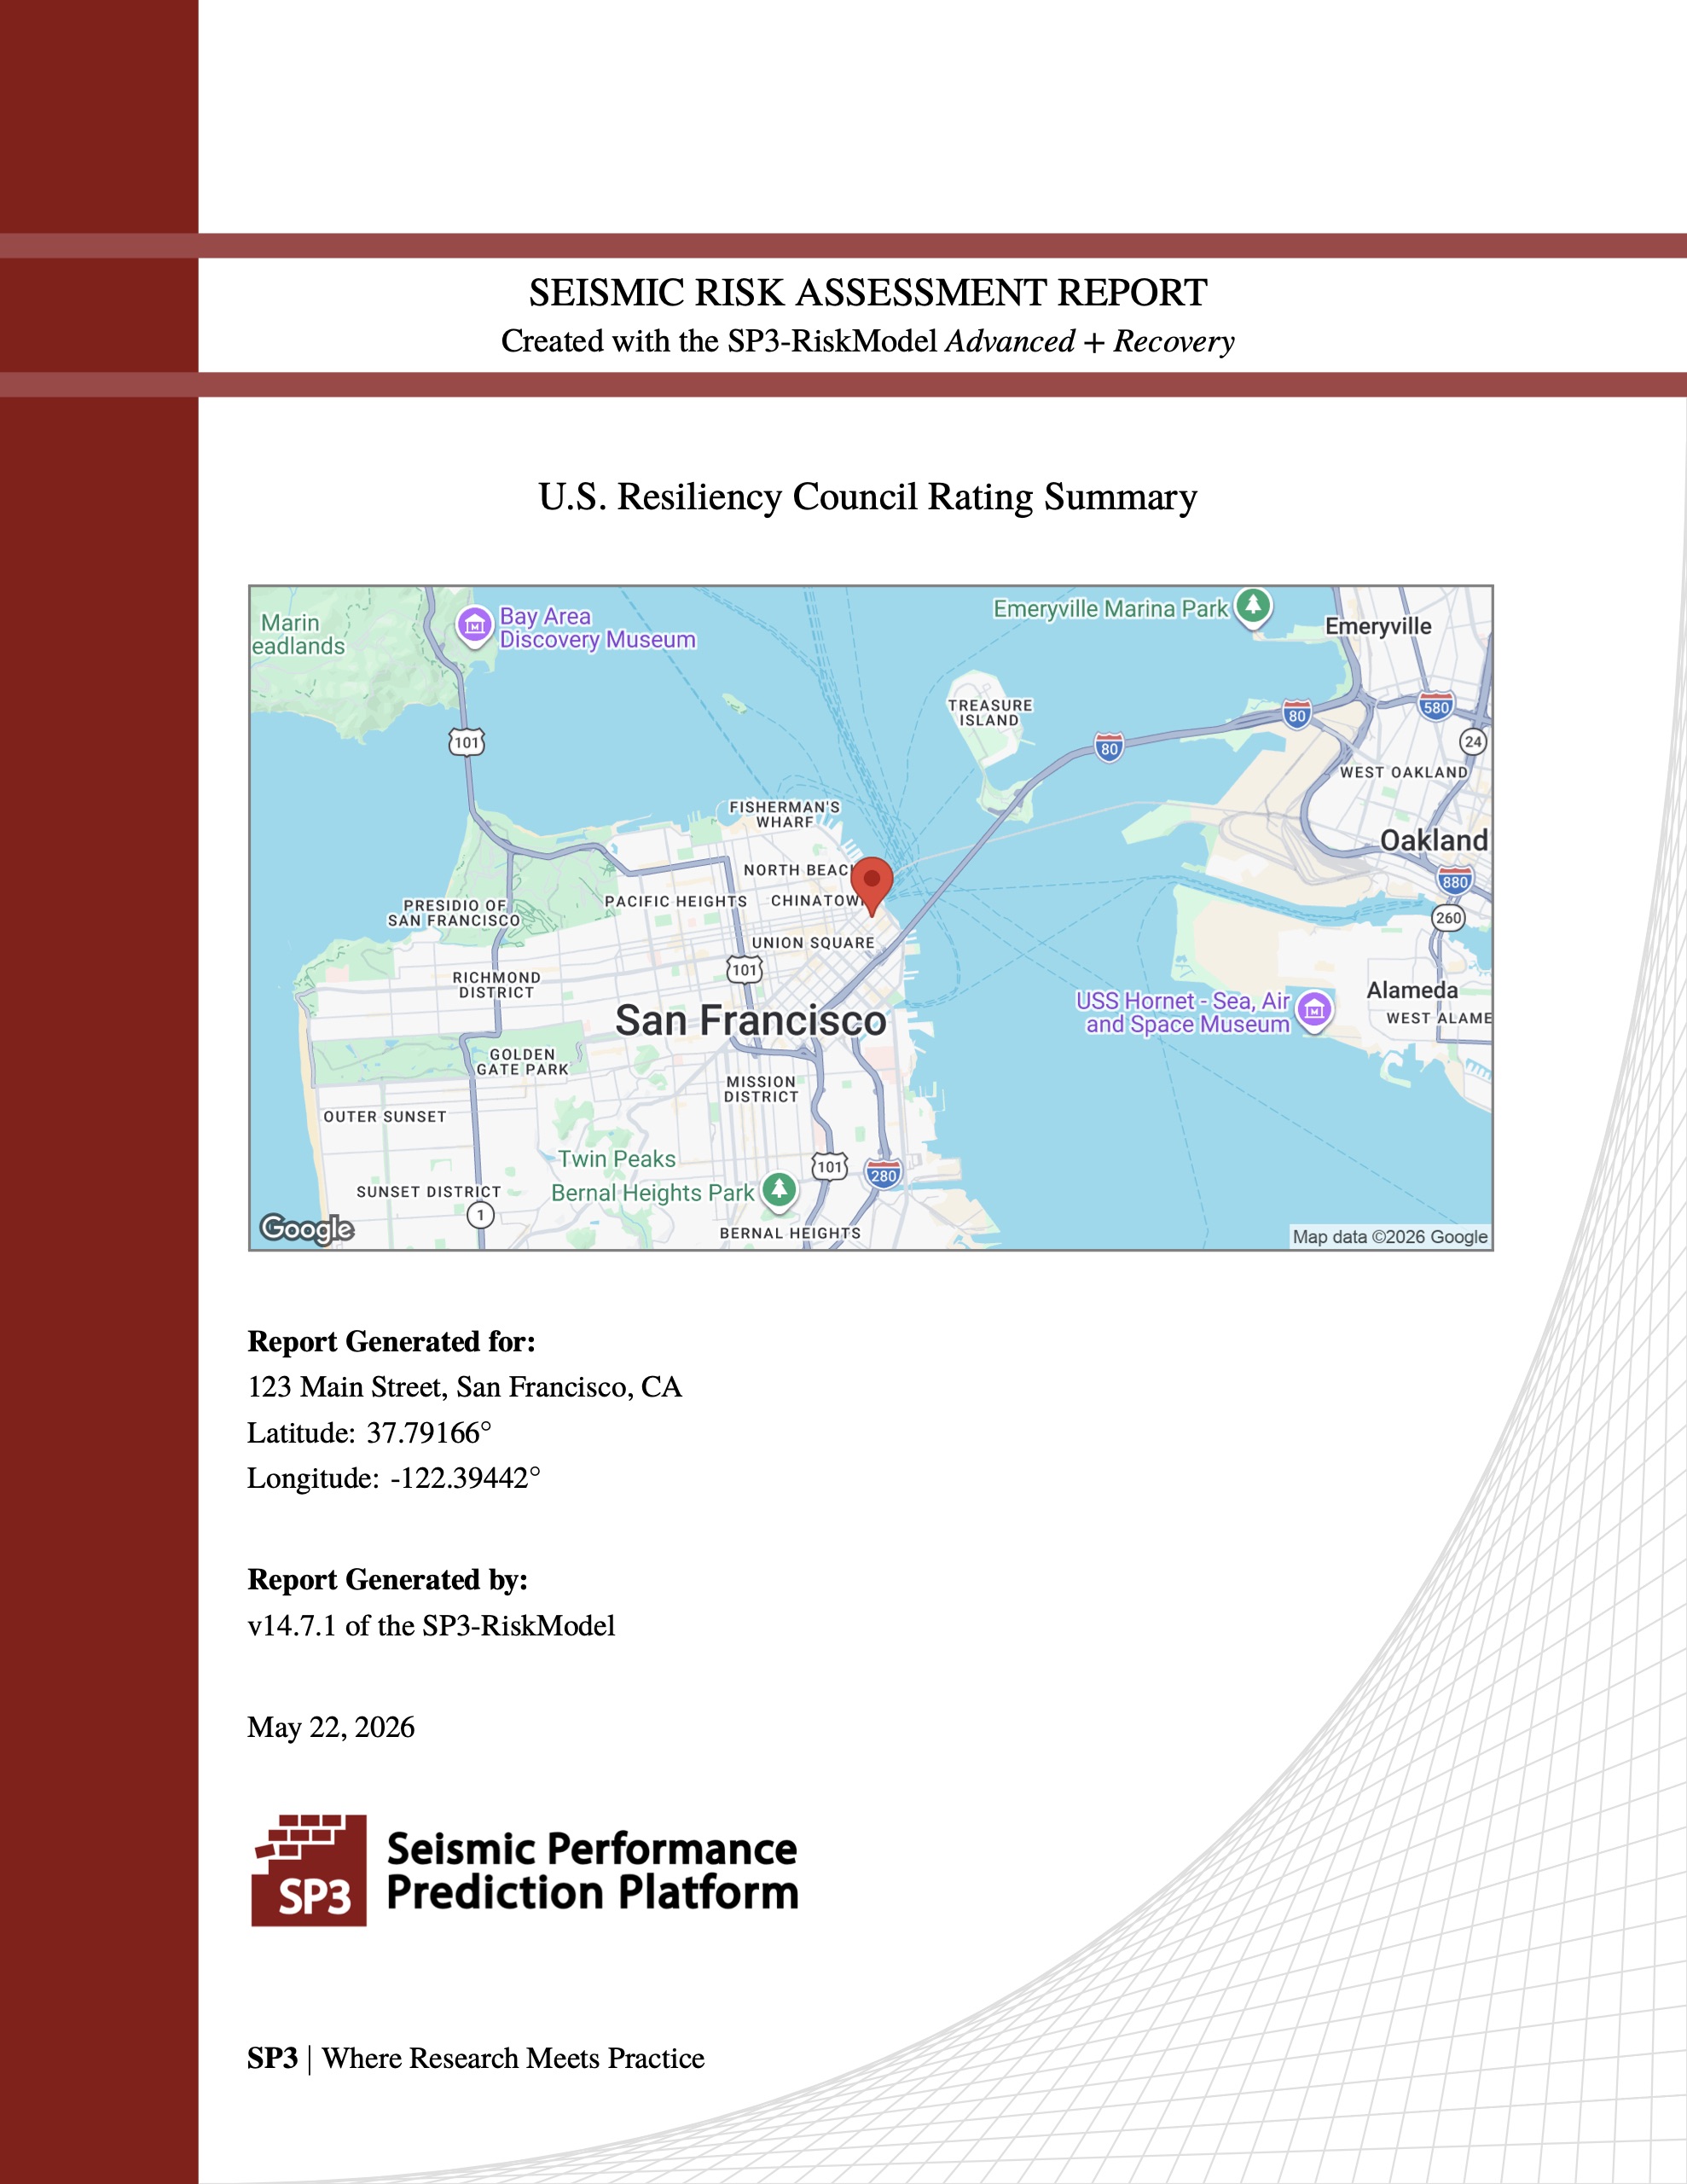
Disclaimer: the sample reports of 123 Main Street are examples of the PDF reports available through this software module and are not associated with an actual project.
License levels
Four levels that grow with your project — from due-diligence loss estimates to full control over every input, with recovery modeling available at either tier.
Standard
Building-specific seismic risk assessment with loss predictions for SEL, SUL, annualized losses, and component group loss breakdowns — the right starting point for most due-diligence work.
Standard + Recovery
Everything in Standard, plus recovery time modeling with predictions for reoccupancy and functional recovery — for when downtime and business interruption matter.
Advanced
Everything in Standard, plus detailed control over building components, structural responses, and building stability — built for engineers who want to define every input.
Advanced + Recovery
Our most complete level: full advanced control plus recovery time modeling for re-occupancy and functional recovery — the choice for resilient design projects.
Features by level
The full feature matrix, level by level. A • marks features included at that license level.
Risk model definition — inputs and modeling control
| Risk Model Definition | Standard | Standard + Recovery | Advanced | Advanced + Recovery |
|---|---|---|---|---|
| Primary Inputs | • | • | • | • |
| Building Layout | • | • | • | • |
| Soil and Ground Motion Info | • | • | • | • |
| User-Defined Seismic Hazard | • | • | ||
| Building Design Info | • | • | • | • |
| Building Component Checklist | • | • | • | • |
| Building Component Auto-Population | • | • | • | • |
| Building Component Group Modifiers | • | • | ||
| Building Component Table | • | • | ||
| User-Defined Building Component Table | • | • | ||
| Structural Properties | • | • | • | • |
| User-Defined Building Period & Base Shear Strength | • | • | • | • |
| User-Defined Mode Shapes | • | • | ||
| Structural Responses | • | • | • | • |
| SP3 Response Prediction Engine | • | • | • | • |
| User-Defined Response History Analysis Results | • | • | ||
| User-Defined Medians | • | • | ||
| Building Stability | • | • | • | • |
| Automated FEMA P-154 Scoring | • | • | • | • |
| User-Defined Scoring Options | • | • | • | • |
| User-Defined Collapse Definition | • | • | • | • |
| Repair Time Options | • | • | ||
| Impedance Factors | • | • | ||
| Mitigation Factors | • | • | ||
| Functional Recovery Options | • | • |
Risk analysis results — outputs, downloads, and reports
| Risk Analysis Results | Standard | Standard + Recovery | Advanced | Advanced + Recovery |
|---|---|---|---|---|
| User-Interface: Risk Analysis Results | • | • | • | • |
| Component Breakdown - Annualized and Scenario Loss | • | • | • | • |
| Repair Costs Exposure | • | • | • | • |
| Repair Costs by Intensity | • | • | • | • |
| Annualized Losses - Component Breakdown | • | • | • | • |
| Recovery Times by Intensity | • | • | ||
| Downloads: Full Report | • | • | • | • |
| Summary of Risk Analysis Results | • | • | • | • |
| Risk Model Definition | • | • | • | • |
| SP3 Performance Factors | • | • | • | • |
| Repair Costs - Component Group Breakdown | • | • | • | • |
| Repair Times by Intensity | • | • | ||
| Downloads: Component Report | • | • | ||
| Component Damageability and Cost Overview | • | • | ||
| Component Quantities and Modification Factors | • | • | ||
| Component Fragility Information | • | • | ||
| Detailed Component Damage Breakdown | • | • | ||
| Downloads: Functional Recovery Report | • | • | ||
| Recovery Time Overview | • | • | ||
| Component Damage Overview | • | • | ||
| Detailed Reoccupancy and Functionality Results | • | • | ||
| Repair Time Schedules | • | • | ||
| Downloads: USRC Report | • | • | ||
| U.S. Resiliency Council Seismic Rating | • | • |
See your building in SP3
Book a live demo and an SP3 Team engineer will run a building like yours through SP3-RiskModel — inputs, results, and report — in about 30 minutes.
Request a Demo → Contact Us