
Platform · SP3-Portfolio
Portfolio risk, modeled building by building
SP3-Portfolio brings portfolio-level loss modeling together with the building-specific vulnerability curves from SP3-RiskModel and SP3-Batch — so you never fall back on generic building-class assumptions.
Your portfolio is made of specific buildings — model it that way. SP3-Portfolio is the portfolio analysis layer of the SP3 platform: the same building-specific risk modeling you use on individual assessments, applied consistently across the full inventory.
Illustrative — each bar is one building’s own model, on the SP3 loss scale.
Why it's different
Building-specific, not class-generic
Every building in the inventory carries its own vulnerability curve, sourced from SP3-Batch or SP3-RiskModel — so you can mix models of different refinement in a single portfolio.
Downtime, not just dollars
Results go beyond repair cost to reoccupancy time, functional recovery time, and full repair time — the metrics that actually describe business interruption.
Built for where data runs out
Because SP3 is engineering-analysis-based rather than experience-based, it predicts vulnerability for modern construction types that have little or no earthquake loss history.
Under the hood
- Site-specific ground shaking computed from local soil properties, with full simulated spectral shapes.
- Monte Carlo shaking simulations that honor site-to-site and period-to-period correlation, for spectral accelerations from 0 to 5 seconds.
- Per-building response assessment at each building's own period, with a three-mode structural response analysis embedded in the vulnerability process.
- End-to-end uncertainty tracking across earthquake occurrence, ground shaking, structural response, damage, repair costs, and downtime.
- Comprehensive outputs — exceedance probability curves plus scenario and ShakeMap consequences, reported as ground-up loss, insured loss, and client loss alongside recovery times.
- UCERF3 event sets from the Third Uniform California Earthquake Rupture Forecast.
Coverage: SP3-Portfolio covers all California locations today, with additional regions in subsequent releases.
Example outputs
Exceedance probability curves, scenario losses, and building recovery times — the deliverables your stakeholders actually ask for.
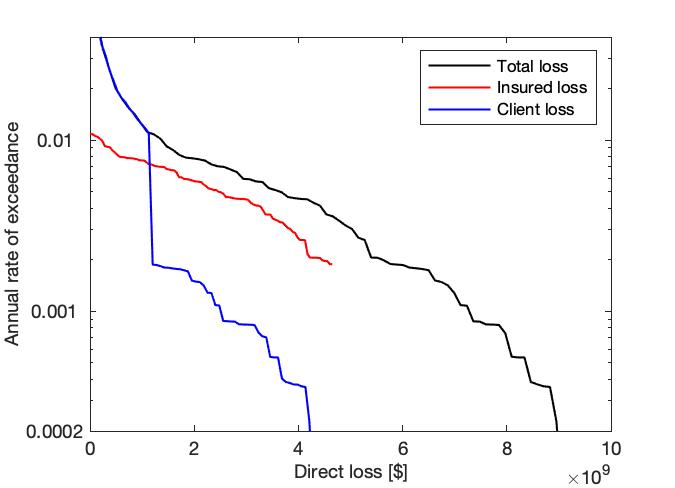
Loss exceedance — baseline with insurance
Exceedance probability curves for the portfolio's repair costs, with the insurance structure applied.
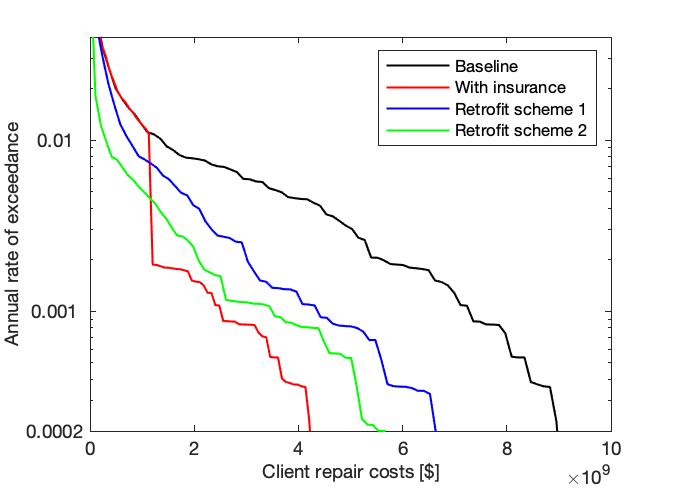
Loss exceedance — effects of retrofit decisions
Compare exceedance curves across retrofit options to see what an upgrade actually buys the portfolio.
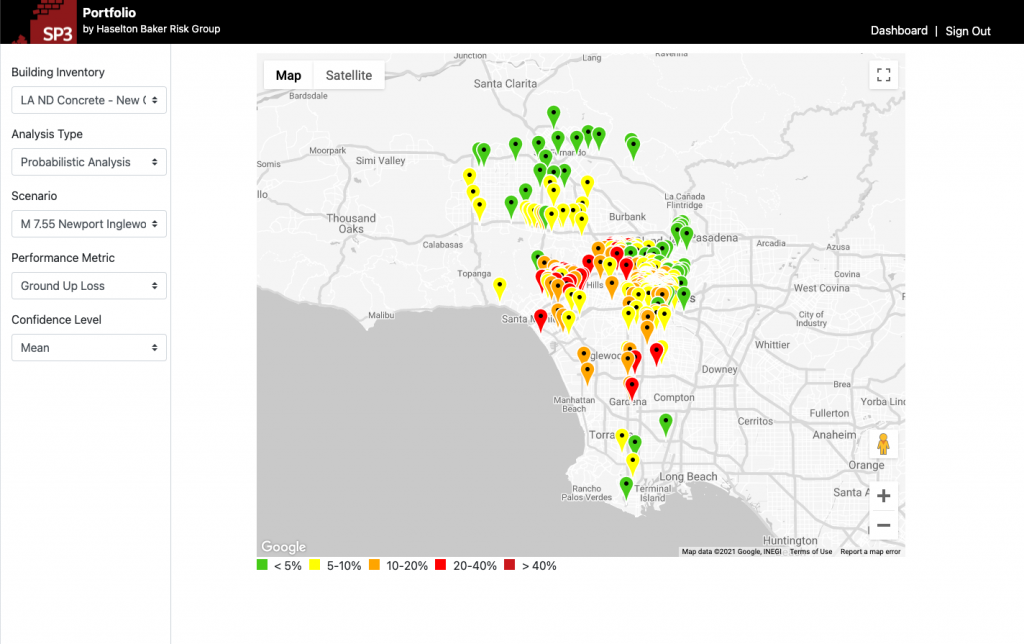
Scenario assessment — repair costs
Building-by-building repair costs across the portfolio for a chosen earthquake scenario.
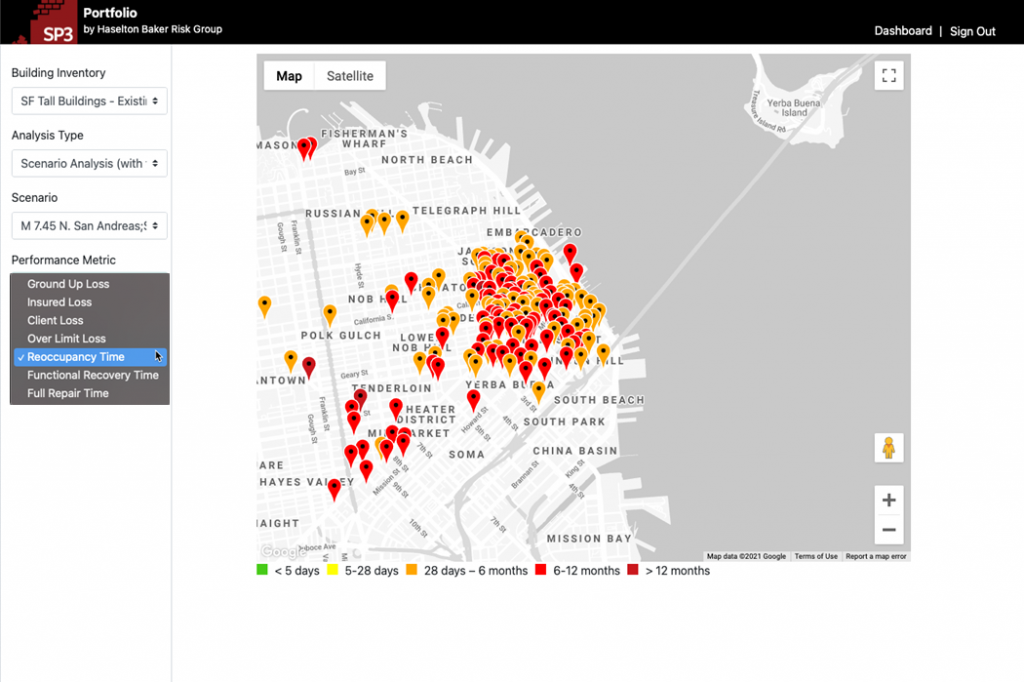
Scenario assessment — functional recovery times
Predicted functional recovery time for each building under an earthquake scenario — the downtime picture behind business interruption.
Why building-specific vulnerabilities
Portfolio loss assessments have traditionally relied on generic fragility curves — HAZUS, ATC-13, and similar judgment- and experience-based curves used in catastrophe models. SP3 replaces them with engineering-analysis-based vulnerabilities, built the same way for one building or a thousand.
Built for buildings without loss history
Modern 3–5 story wood light-frame buildings, post-Northridge tilt-ups and steel moment frames, modern tall buildings — common construction with virtually no earthquake experience data to constrain a generic curve.
Validated where data does exist
SP3's building-specific vulnerability modeling has been benchmarked against the earthquake experience data we do have, including hindcast loss estimates for the 1994 Northridge earthquake.
Consistent across every level of analysis
Because the methodology is engineering-analysis-based, the same models that were validated on past earthquakes can forward-predict vulnerability where no data exists — and the curves in your portfolio runs match your SP3-RiskModel and SP3-Batch assessments.
White paper (PDF)
Post-earthquake functional recovery of new California residential buildings (April 2021) — the 3–5 story wood light-frame case study.
Validation paper (PDF)
Hindcast loss estimates for the 1994 Northridge earthquake (2020) — benchmarking SP3 predictions against observed losses.
Recorded presentation
Detailed Benchmarking and Validation Studies of the SP3-RiskModel — in the SP3 training library.
A journal paper on the validation studies is available upon request.
Bring building-specific risk to your portfolio
Tell us about your portfolio and we'll show you what SP3-Portfolio produces — and how it compares to the generic curves you're using today.
Request a Demo → Contact Us