
Cleaner, lighter, easier to read. Not one number has changed.
If you run seismic assessments, you spend a good part of your week inside this software. It should be easy to look at.
So SP3-RiskModel and SP3-SiteHazards have been refreshed throughout, with a lighter layout, clearer tables and charts, and a look that matches sp3risk.com. The analysis underneath is untouched: same engines, same inputs, same results.
This is a visual refresh only. There are no new features and no changes to the analysis, the workflow or the results.
Screenshots use sample data. Model names, locations, authors and loss values are illustrative.
A cleaner home base for your models
The Models dashboard carries a new white header and the SP3 cardinal. Striped rows with soft, rounded edges make a long list easier to track across. Expected loss (SEL) and upper-bound loss (SUL) sit side by side, with a completed-run check on every model.
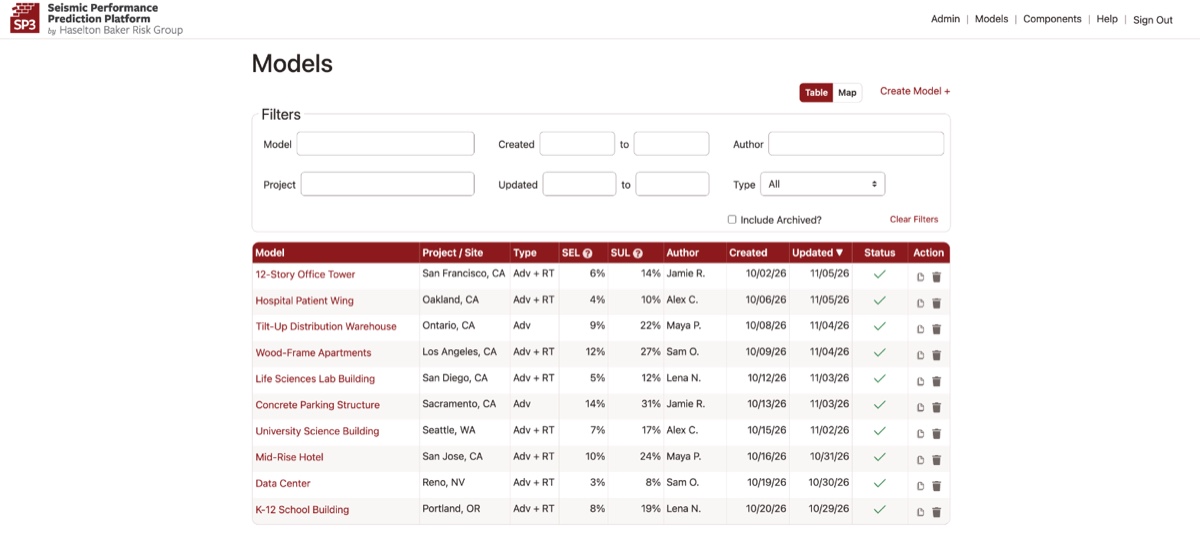
The Models dashboard, with sample models.
Charts that are easier to read, and easier to share
Component-group charts use a new eight-color palette, with one color for each group. The old default olive and red sat uncomfortably close to the SP3 brand red, and both are gone. Charts now sit in a clean frame with the legend alongside, ready to drop straight into a client deck.
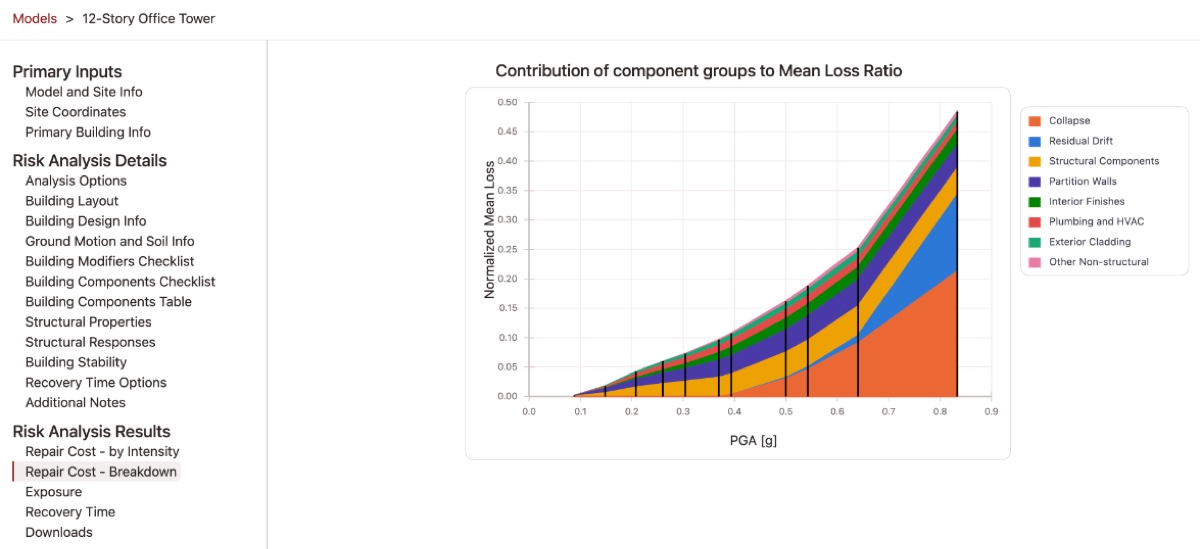
Repair Cost Breakdown, showing each component group's contribution to mean loss.
A clearer look at what SP3-AI found in your report
Every value SP3-AI-ReportReader pulls out of a structural report is tagged SP3-AI and left for you to accept or reject. The sidebar keeps a running count of what is still to review, with an Accept all shortcut when you are confident. You always know exactly what the model is about to run on.
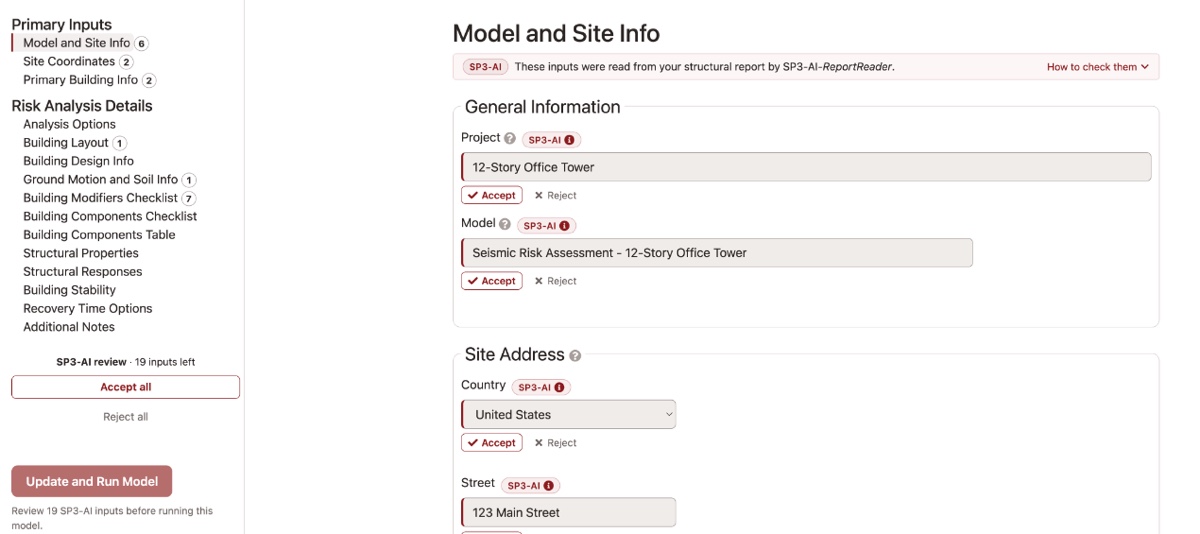
Reviewing SP3-AI inputs, one field at a time or all at once.
Status you can read at a glance
Errors, warnings and successes each have their own color and their own icon. A warning never reads as the brand red, and color is never the only signal.
Nothing to do
It arrives on its own. Every page is where you left it, every input means what it meant, and every number comes out of the same analysis. If you have used SP3-RiskModel before, you already know how to use this.
Sign in to SP3 → Request a Demo →
Not an SP3 user yet? Request a demo and an SP3 engineer will run a building like yours, live, and answer your questions.
Questions? Contact support@hbrisk.com or +1 (530) 531-0295.